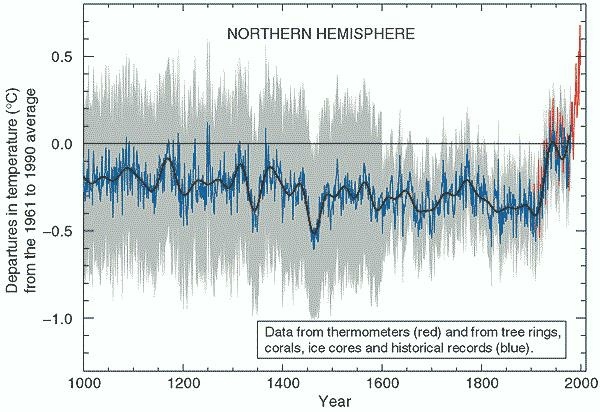
A number of proxies, including tree rings and ice cores, are used to extend the temperature record to periods prior to direct measurements by thermometers starting in the 1880s. Tree rings from several sites were used by the IPCC (2001) to compute the global average temperature for the past 1000 years. The graphs of temperature showed nearly constant temperature for 1000 years. It was combined with the observed temperature after 1950 and showed the temperature rapidly rising in conjunction with the increased carbon dioxide in the atmosphere that was observed. This figure became the basis for much of the AGW theories and is shown below. A popular book “An Inconvenient Truth” written by former Vice President Al Gore in 2006, used the increasing CO2 graph and the temperature graph in his presentations to describe the dangers of the CO2 emissions. The book was made into a movie and Gore won a Movie Academy Oscar (2007). The 2007 Nobel Peace Prize was awarded to the Intergovernmental Panel on Climate Change (IPCC) and Al Gore for their work in promoting awareness of Global Warming. Much was made of the Figure when it was introduced in 2000. And it is the graph that most people associate with Global Warming.
 |
|
IPCC Temperature Graph 2001 |
A number of problems arose in conjunction with the graph and the IPCC did not use the figure in later assessment reports in 2007 and 2013.
Problem 1, Statistical and Observational Temperatures. The first was that the temperature representations until 1950 were based on the statistical method results from tree rings and direct observations were added showing a very rapid temperature rise through 2000. Many scientists believe this is akin to comparing apples and oranges.
Problem 2. Historically Not Accurate. The second problem was the change in the climatological history of global temperatures over the past 1000 years. Prior to the invention of the thermometer, it is necessary to estimate temperatures from various sources such as tree rings, ice cores in Greenland and the Antarctic, or historical documents during the past thousand years. It is well known that both colder ice ages and much warmer periods have occurred in the geological life of the earth. There are many theories about the causes of the temperature changes with most focusing on changes in the solar output, or in changes to the earth’s solar orbit. The last ice age peaked about 25,000 years ago and ice covered New England up to a mile thick with a significant lowering of the oceans. Obviously, Man did not end the ice age because he had fires in the caves.
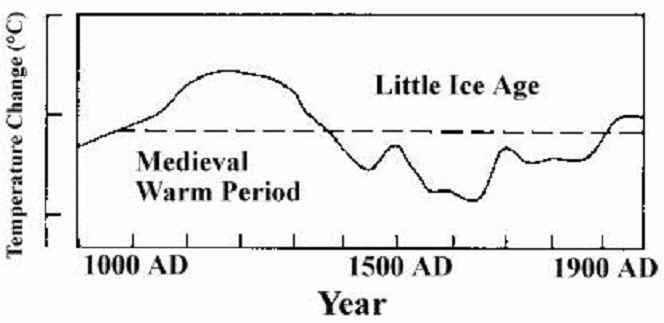
In the past thousand years, the early estimates of the global temperature indicated a Medieval Warm period about 1000 AD when the Viking farmers settled Greenland for 300 years and Vikings landed in Labrador and Newfoundland. Historical records indicate it was a warm period for several hundred years in Europe and in other parts of the world. This was followed by a cold period from 1450 to 1850 that is known as the Little Ice Age. Certainly, there are historical accounts from the colonial period and the American Revolution on the extreme cold of this period. For example, the Connecticut River often froze from October to May in the 18th century. In the first and second IPCC assessment reports, the graph above was presented. Then it gradually started to warm.
When the IPCC Temperature graph was introduced, the IPCC indicated that the Medieval Warm Period and Little Ice Age were just regional events in Europe and had little impact on the global temperature. Further research has shown that similar temperatures were observed on a world-wide basis. Thus the figure did not reproduce what was known about the temperature changes of the past 1000 years and was not included in future IPCC reports. The IPCC description in 2007 about temperatures in the last 1000 years was:
the warmest period prior to the 20th century very likely occurred between 950 and 1100. The evidence currently available indicates that NH mean temperatures during medieval times (950–1100) were indeed warm in a 2-kyr context and even warmer in relation to the less sparse but still limited evidence of widespread average cool conditions in the 17th century.
Problem 3 Statistical Method. The third major problem with the IPCC Figure was the statistical method used to compute the global temperature using tree ring data. Several statisticians found that the graph could be reproduced with most forms of data including random data points. The graph was not used in later assessment reports by the IPCC.